
This model is the best one to date describing the basic mechanics of how coronavirus spreads and the effect of different containment measures. I’ll use it as a backdrop for understanding what’s going on, what we should expect to happen, and the likely effects of different interventions. Instead of trying to piece together a clean narrative, I’ll just make basic notes.
-This model ignores the possibility of discovering effective vaccines or antiviral therapies. Those things are likely 12-18 months away anyway.
Model Mechanics
-They use previously verified and very detailed models of how infectious diseases spread through the US and the UK. The basis of the model is regional age demographics along with interactions that happen in four areas: (1) schools (including universities), (2) work, (3) home, (4) everywhere else. Schools account for the largest chunk of transmission because they have the perfect (for the virus) mix of people spending a lot of time in close quarters but also mixing together with new groups of people. Work is the second biggest. There’s an extremely high chance of the virus spreading in the home, but because you mix with the same small number of people at home every day, this makes a very small contribution. The final group of everywhere else is also relatively small because these other interactions tend to be very brief.
Model Parameters
-The model takes an educated guess that people become infectious 4.5 days after they themselves are infected. This is an educated guess.
-The incubation time for symptoms is 5.1 days. This is based on real data, not an educated guess, but of course involves some modeling because we don’t observe the instant people get infected.
–This results in a mean generation time of 6.5 days
-The best guess of R0 is 2.4, but they run simulations from 2.0 to 2.6.
-Symptomatic individuals are 50% more infectious than others (they cough all over the place)
-Most evidence suggests reinfection is not possible, though there are scattered reports otherwise.
-1/3rd of cases are asymptomatic (combination of data and guesswork)
-The overall infection fatality rate, when adjusted to the age demographics of the UK, is 0.9%.
-The overall hospitality rate is 4.4%.
-30% of hospitalizations require critical care (ventilation) independent of age, based on early data from China and Italy
-50% of critical care patients die, independent of age, and an age-dependent fraction of non-critical cases die (this term exists so they can match the observed fatality rates by age)
-Non-critical cases spend 8 days in the hospital
-Critical cases spend 16 days, with 10 in the ICU
–These values for hospital stays roughly match general pneumonia cases and early COVID data
Below is the current best estimate of infection fatality rate by age.
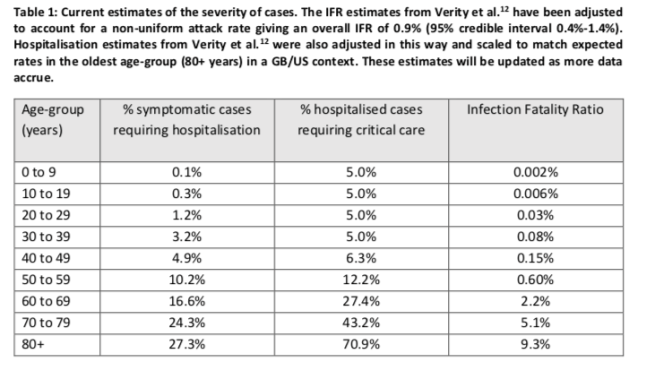
One of the main results below is that if we don’t do enough, ICUs will be overwhelmed. But, as far as I can tell, the model doesn’t include an adjustment to critical care fatality rates if someone who needs an ICU bed doesn’t get one. Worst case, if nobody at all got ICU care, this could double the fatality rate (because they assume 50% ICU fatality).
Interventions
To understand their simulation results, you need to pay close attention to how they define the interventions. Some are not defined the way I’d guessed.
- Case isolation – Symptomatic people stay home starting 1 day after their symptoms. Assume 70% compliance.
- Home quarantine – Symptomatic people and their whole families stay home starting 1 day after symptoms. Assume 50% compliance.
- Social distancing over 70 – Assume 75% compliance. The compliant people reduce workplace contact by 50% and other out-of-home contact by 75%.
- Social distancing of entire population – “everywhere else” contact reduced by 75%. Workplace contact only goes down 25%. School contact actually remains unchanged, so the name of this intervention is misleading, “entire population” should read “everyone but students”
- Close schools – 100% of schools below college close, 75% of colleges close. “Everywhere else” contacts increase 25%.
The main takeaway I get from these definitions is that they’re actually modest. Shelter-in-place orders (which let people walk outside at will) and lockdowns (which don’t) are both much tighter than any of the interventions they consider.
Results
If we do not do a single thing differently from normal, roughly 0.7-0.8% of the population will die. 2.2 million in the USA. 510k in the UK. That’d be about 57 million people if extrapolated to the entire world.
Of course, even if governments do nothing, people will do something. So what happens then? Any one of these interventions alone leaves us way over ICU bed capacity. The general population social distancing cases – which closes events and reduces workplace contact by 25% but leaves schools open – still leaves us about a factor of 2 over ICU bed capacity. They don’t report total deaths in this case, but I think the general consensus would be that this outcome is unacceptable.
If you close schools early on, then we stay well below ICU bed capacity and R0 drops below 1, so the virus slowly dies out. The problem is that the virus isn’t totally eradicated, so if you remove these constraints before vaccinating the population, exponential growth resumes. Leaving the controls on until there’s a vaccine keeps COVID-19 fatality very low, but presumably leads to other massive social costs.
The purpose of this paper was to encourage policy-makers to take drastic action. It has partially worked. Anyone who isn’t willing to accept millions of deaths in the US and tens of millions worldwide should comply with and encourage extensive physical isolation. However, I think this paper leaves some silver linings for the economy. The authors’ definition of general social isolation still allows for workplace contact to stay at 75% of normal, which their model predicts is enough to stamp the disease out (as long as you close schools). After a month or so of this extremely high level of isolation, if testing capacity and the production of protecting equipment for healthcare workers can catch up to the need, we should be able to ease up a bit. Policymakers could come up with more precise rules that let more people go back to work while keeping total workplace contact below 75% of normal. We should be able to find 25% of workers who can work from home.
On the other hand, governors who are showing reluctance to drastically reduce workplace and school contact rates are being foolish. If large numbers of their residents don’t spontaneously work and study from home, millions of people could die unnecessarily.
