Will summer weather slow down the spread of coronavirus? A pair of MIT postdocs have taken a first, very simple stab at answering that question. Their paper is here. They counted up new cases in different countries or US states in 10 day chunks. Then they made a histogram of new cases versus temperature. 90% of new cases happened in areas with a temperature between 3 C and 17 C, or 37 F to 63 F.
They used data through March 19. For this simple analysis, they didn’t try to adjust for anything: suppression measures, population, or the date of first infection.
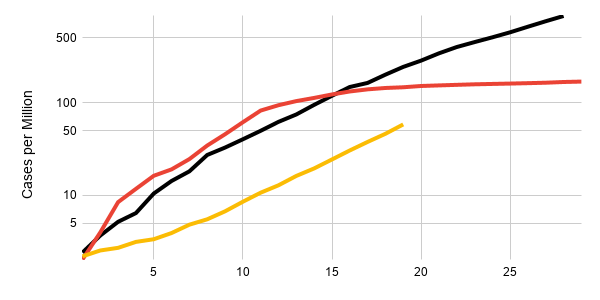
As another simple analysis, I’d like to compare exponential growth rates after some threshold is passed. The virus started in a cold place probably by coincidence. I’ve been using 2 cases per million population for all the plots I’ve made so far, so I’ll do the same to compare Italy, Korea, and Australia.
I’m plotting this on a logarithmic scale. As a brief refresher, exponential growth on a log scale should look like a straight line. A lower growth rate would show up as a lower slope. Parallel lines are growing at the same rate.

So is the spread in hot, humid Australia slower than chilly Italy and Korea? Maybe. It looks like for the first 7 or 8 days after reaching 2/M, Australia had a lower growth rate. But after that it looks pretty close to parallel with the line for Italy.
I’d considered using India as my representative hot country, but it’s still well below 2 cases per million people. Of course, that itself is evidence for the hypothesis that hot weather slows the virus down.
I think the jury is still out on this one.


There are many other things happening at the same time as weather patterns change, including correspondent changes in human behavior, and deleterious mutations in the virus.
I thought this was a good analysis of the topic:
https://www.sciencemag.org/news/2020/03/why-do-dozens-diseases-wax-and-wane-seasons-and-will-covid-19
LikeLike