
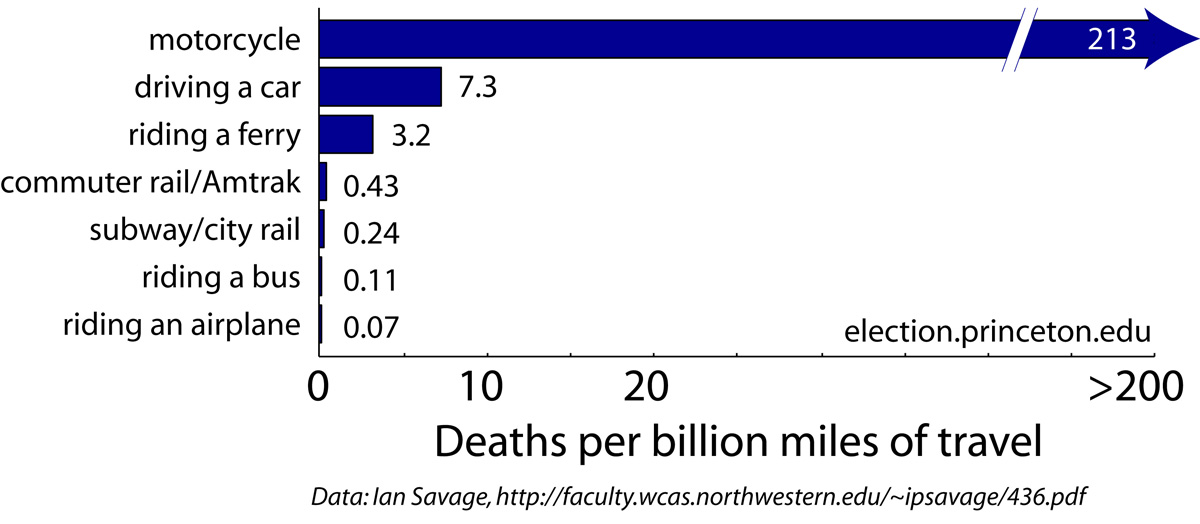
You’re about 100 times more likely to die traveling the same distance in a car as in a plane. See the graph below (made by these people with data from this paper covering the decade 2000-2009). I want to find out if there are choices I can make as an individual to make driving just as safe as flying. The same table below gives me reason for optimism: traveling by bus is only slightly more dangerous than traveling by plane.
The Insurance Institute for Highway Safety (IIHS) shares a wealth of data on fatal car crashes. It’s useful for individuals as well as policy makers. Some of these lessons are obvious, but I still think it’s useful and fun to quantify how big of a difference common sense makes.
As a baseline, the IIHS data shows in 2018 there were 1.13 motor vehicle crash deaths per 100 million miles traveled. They’re counting deaths of pedestrians in there and merging cars and motorcycles, so it doesn’t quite match the number in the plot above. 21% of the fatalities were pedestrians, bicyclists, or “other”. So the baseline for people in the vehicle is 0.89 deaths per 100 million miles.
So what factors make driving safer?
In 2018, 49% of drivers who died were known to be wearing a seatbelt. In 8% of cases, their seat belt status wasn’t recorded, so I’ll adjust this to say 49 / .92 = 53% of passenger fatalities. Without knowing how many people wear seatbelts, though, we can’t say how much likelier you are to die without a seat belt. It could be that 53% of drivers don’t wear seat belts and seat belts don’t make any difference.
Fortunately we have pretty good data on seatbelt use. Researchers working for the National Highway Traffic Safety Administration (NHTSA) creep on people while they’re driving to see how many of them wear seat belts. The answer in 2018 was 89.6%. If 89.6% of drivers wore a seat belt but accounted for only 47% of fatalities in 2018, we can infer that passengers with a seatbelt were 87% less likely to die than driving without a seatbelt.
[Badly formatted math notes you can skip] From Bayes’ rule, we know,
P(death | belt) = P(belt | death) * P(death) / P(belt), and
P(death | no belt) = P(no belt | death) * P(death) / P(no belt)
Divide the first line by the second line to get
P(death | belt) / P(death | no belt) = (P(belt | death) / P(belt)) / (P(no belt | death) / P(no belt))
= (0.53 / 0.896) / (0.47 / 0.104)
= 0.13
The overall death rate, 0.89 passenger fatalities per 100 million miles, is a weighted average of the belted and un-belted miles traveled, so we can then infer that the death rate was 4.0 per 100 million miles un-belted and 0.53 per 100 million miles belted, which is about 40% lower than the simple average rate of 0.89 per 100 million miles.
One big caveat for the calculation I just did: the 0.89 deaths per 100 million miles number includes motorcycles, which aren’t counted one way or the other in the 53% of passenger vehicle deaths. So the real fatality rate for passengers with a seatbelt on in 2018 was below 0.53.
2) Don’t drive drunk
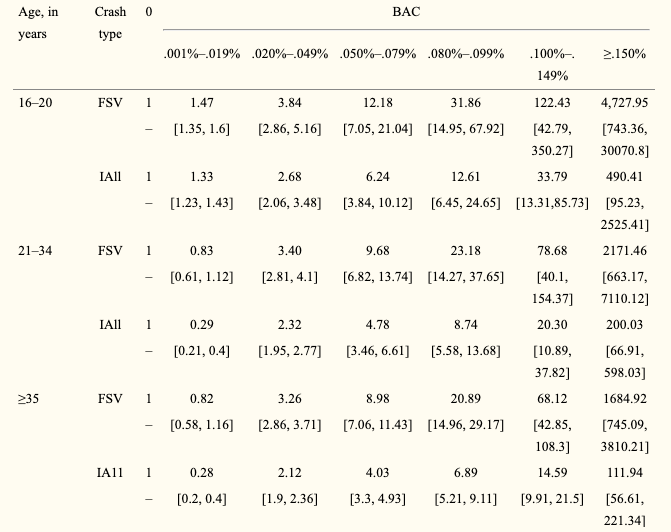
29% of passenger vehicle driver deaths happen when the driver has a BAC over 0.08%. Finding out how many people are how drunk is a lot more difficult than checking how many people wear seatbelts. But this paper does just that, pulling over thousands of people at random and asking them to take a breathalyzer. Oddly, the paper doesn’t actually share the results of the alcohol survey. They skip straight to the relative risk of being in a fatal accident by BAC.
Their main results are in the table below. “FSV” means “fatal single vehicle” and “IAll” means the driver was involved in a fatal accident. (They make some confusing statements about whether or not driver deaths are included in IAll, though…) It’s already illegal for people under 21 to drive with a BAC over 0. This table shows that’s a good idea. People 21 and over don’t seem to be any more dangerous with a BAC up to .019% than they are with a BAC of 0. For individuals 21 and over, avoid driving with a BAC of .02% or higher. For policy makers, lowering BAC limits to .05% or even .02% looks like an easy way to save lives (Utah is the only state with a limit below 0.08%).
If we assume that seat-belt use and BAC are independent, we could say that a 30-year-old driving without a seatbelt at a BAC of 0.06% is about 70 times (9.68 / 0.13) more likely to die than driving sober and belted. But it seems unlikely drunk drivers wear their seatbelts. If drunk drivers are a perfect subset of people driving without a seatbelt, then the statistics of driving with a seatbelt already capture the benefit of driving sober. I’d bet so few drunk drivers wear seat belts it’s better to assume that none of them do than that 90% of them do. That means driving sober with your seatbelt on still leaves you dead around once in 200 million miles.
Side note, from the first plot we can see that driving a motorcycle is 29 times more dangerous than driving a car. Looks like that’s worse than anyone over 21 driving with a BAC of 0.08 – 0.099.
3) Drive a large SUV
The IIHS data show a pretty strong trend that bigger, heavier cars are safer for the occupants. Like I mentioned at the top, buses are almost as safe as planes. Those are just giant, heavy cars driven by people who aren’t drunk. The IIHS also claims that regulations have made large cars safe(r than they used to be) for the small cars around them. In the distant future, we might all be driving gigantic electric cars with batteries that can go 1,000 miles, but for now, driving a huge car likely comes with a tradeoff in fuel efficiency. That tradeoff is beyond the scope of this post.
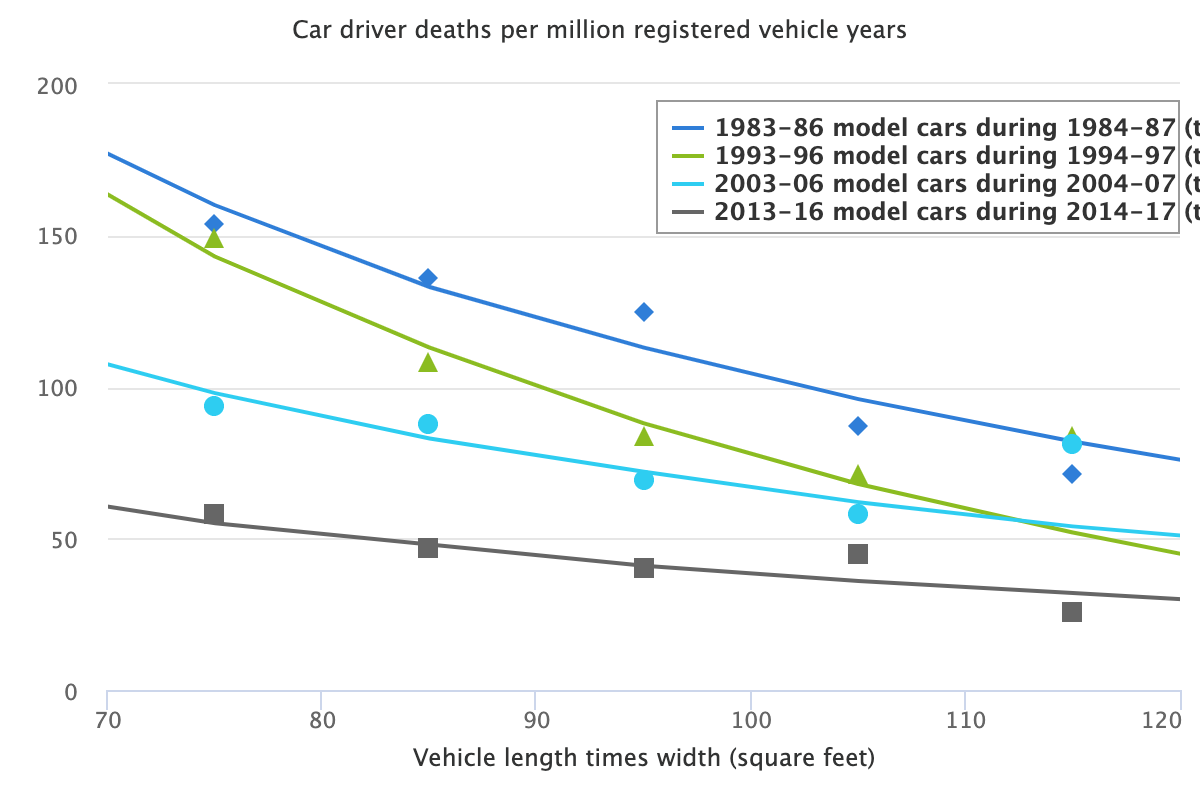
Even independent of weight, it looks like SUVs are probably safer for the passengers than cars. This article, with data hot off the presses from May 2020, finds that small SUVs, which are lighter than large cars (see size group definitions here), have lower driver fatality rates than large cars. It might have something to do with sitting up higher.
If you want to get really specific, you can lookup driver fatality rates by make and model here. It’s a pretty cool dataset. The safest cars to drive were mostly large SUVs. In other words, a bus.
Very large SUV’s had driver fatalities of 0.4 per billion miles. Assuming seatbelt use and drunk driving are independent of car model, then driving that large SUV sober and with your seatbelt on should reduce your risk by a further 40% for about 0.25 deaths per billion miles. That’s about as good as riding the subway, but still not quite as good as a city bus or a plane.
